Data Products & Data Visualization
While working with the Pacific Islands Ocean Observing System (PacIOOS), one of my responsibilities was creating new data products for the webpage. The following are a few samples of my work. I have also included a scientific poster previously presented at a professional science conference for reference.
Ocean Acidification
The iconic carbon dioxide graph used for showing ocean acidification is from data collected around the Hawaiian Islands, so as a website focusing on the ocean and islands around the Pacific Ocean, it was necessary to create a section featuring ocean data monitoring ocean acidification. These pages, besides regular maintenance and updates, appear in their original forms as how I created them.
The project landing page shows the location of various buoys across the Pacific Ocean; the buoys hold instruments measuring carbon dioxide in the atmosphere and in the water. Each yellow buoy icon from the Google map opens to the buoy page containing information about the buoy as well as pulling the latest data from the buoy. Below is an example of the ocean data graphed as well as a table listing the latest data point.

Real-time Wave Observations
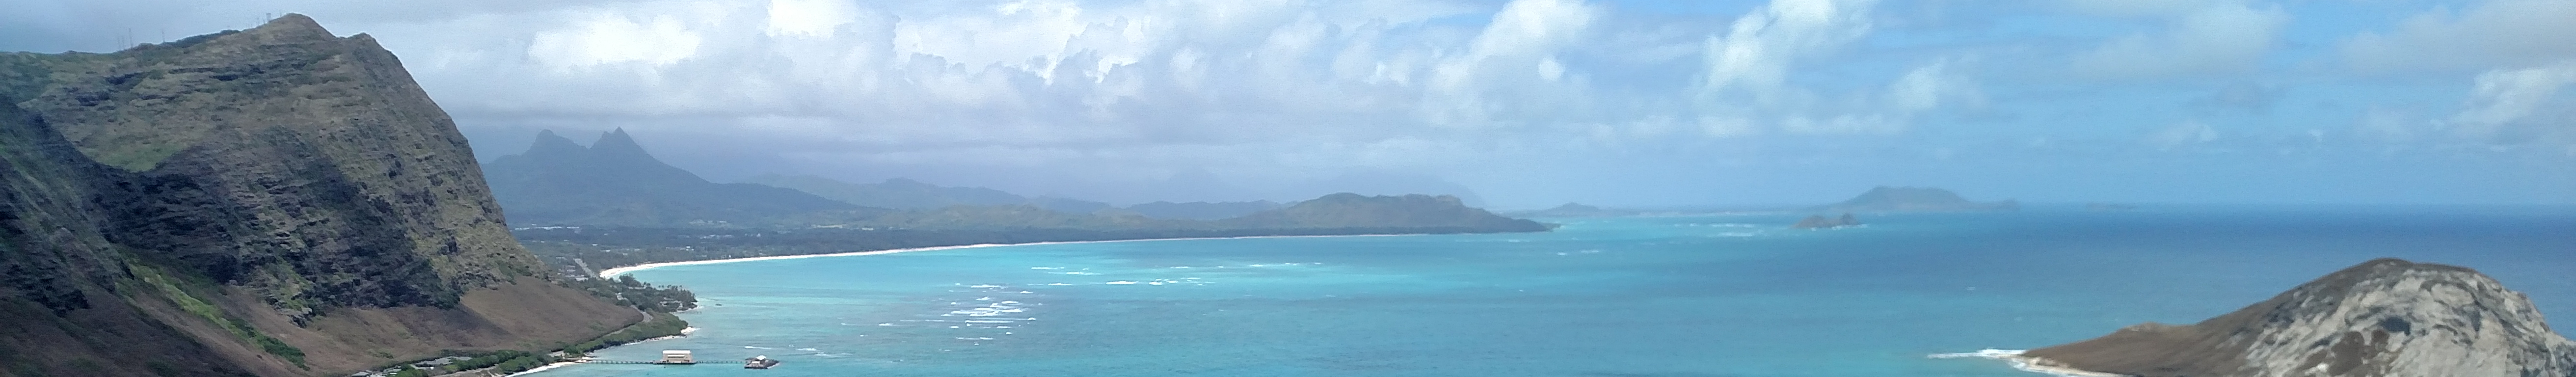
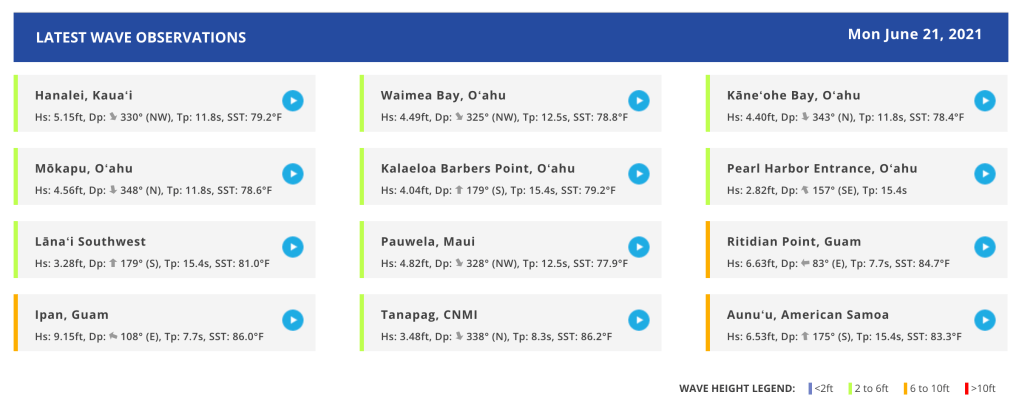
Real-time ocean wave data, such as wave height, period, and direction, is useful for scientists and ocean recreationalists to determine water conditions. For example, a scientist may want to compare the wave conditions between two different locations on the same island or a surfer may want to know the surf at a certain location. Therefore, I was given the opportunity to create a wave data product presenting real-time data from instruments at various locations.
The image below is the updated data product that the Data Team created based off of my original product, found on the PacIOOS landing page.
Conference Poster
Here is a sample of a science conference poster I created, displaying my own and collaborative work. I highlighted different products from PacIOOS that used model data.

